APAST: Advanced Protection and Attack Source Tracing
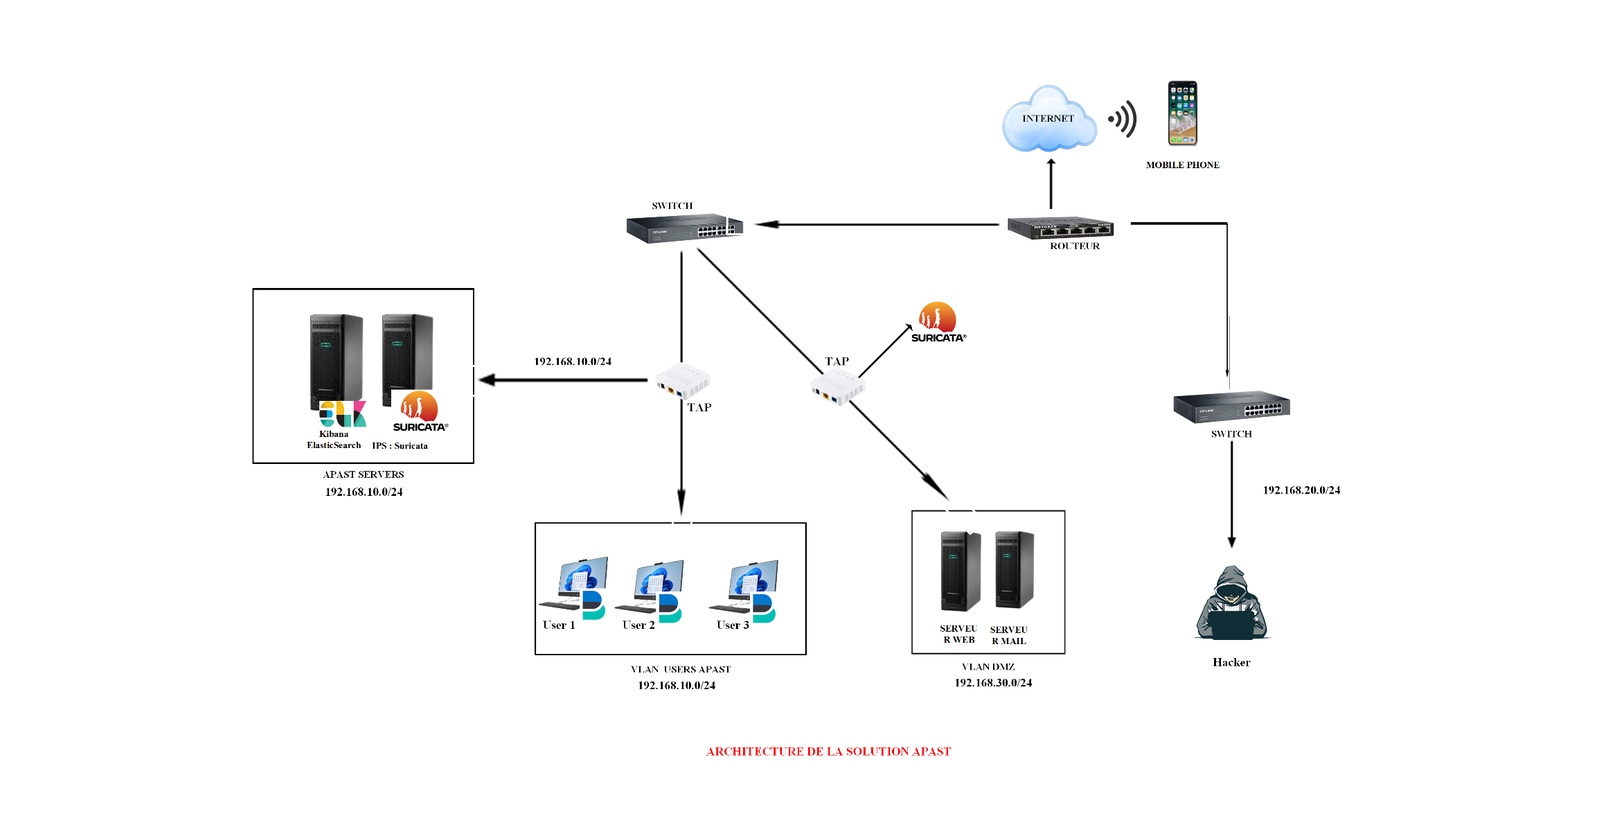
A full intrusion detection system combining network and host monitoring, real-time dashboards, and instant Telegram alerts.
What is APAST?
APAST (Advanced Protection and Attack Source Tracing) is a security monitoring solution I designed and deployed to address a concrete problem: organizations in Africa, and Togo specifically, face a growing volume of cyberattacks with little to no detection infrastructure in place. According to INTERPOL’s 2024 report, Africa recorded the highest rate of weekly cyberattacks per organization globally in 2023, up 23% year-on-year.
The goal was to build something that works, using open-source tools, that can be deployed and operated without a massive budget.
Context, status and my role
APAST was my end-of-degree project at IPNET Institute, supervised by a senior consultant at Cyber Defense Africa. I designed the architecture, installed and connected every component, wrote the Suricata rules and the Telegram bot integration, and ran the tests below.
It is a lab prototype. The attacks in this post were simulated from an isolated attacker network, not observed on a production network. A real deployment would start with several weeks of rule tuning on the organization’s own traffic.
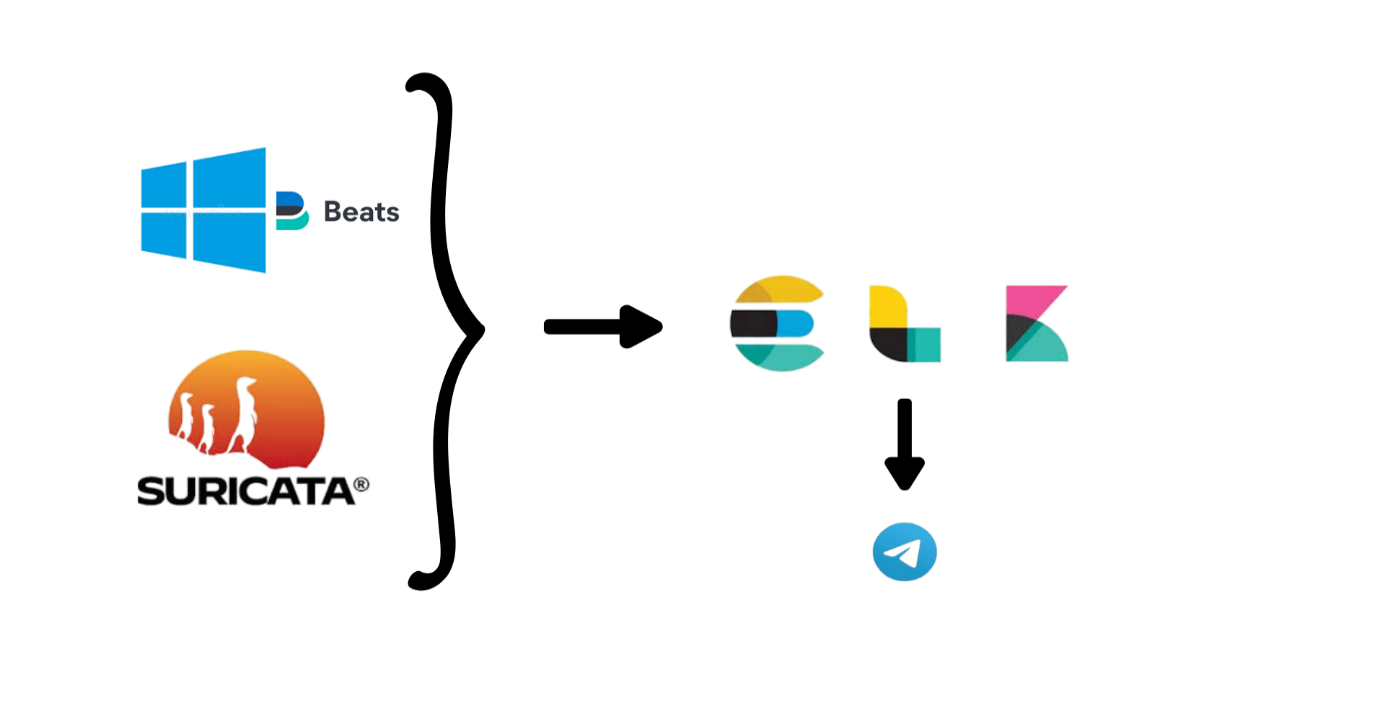 APAST tool stack: Suricata + Winlogbeat → ELK → Telegram.
Stack
| Layer | Tool | Role |
|---|---|---|
| Network IDS/IPS | Suricata | Inspect all network traffic, fire alerts on rule matches |
| Windows host monitoring | Winlogbeat | Collect Windows event logs, forward to ELK |
| Log ingestion | Logstash | Normalize and route events from all sources |
| Storage & search | Elasticsearch | Index and query all security events |
| Visualization | Kibana | Dashboards, geolocation maps, log explorer |
| Real-time alerts | Telegram Bot | Push notifications on detected threats |
Everything except the physical hardware is open-source and free.
Architecture
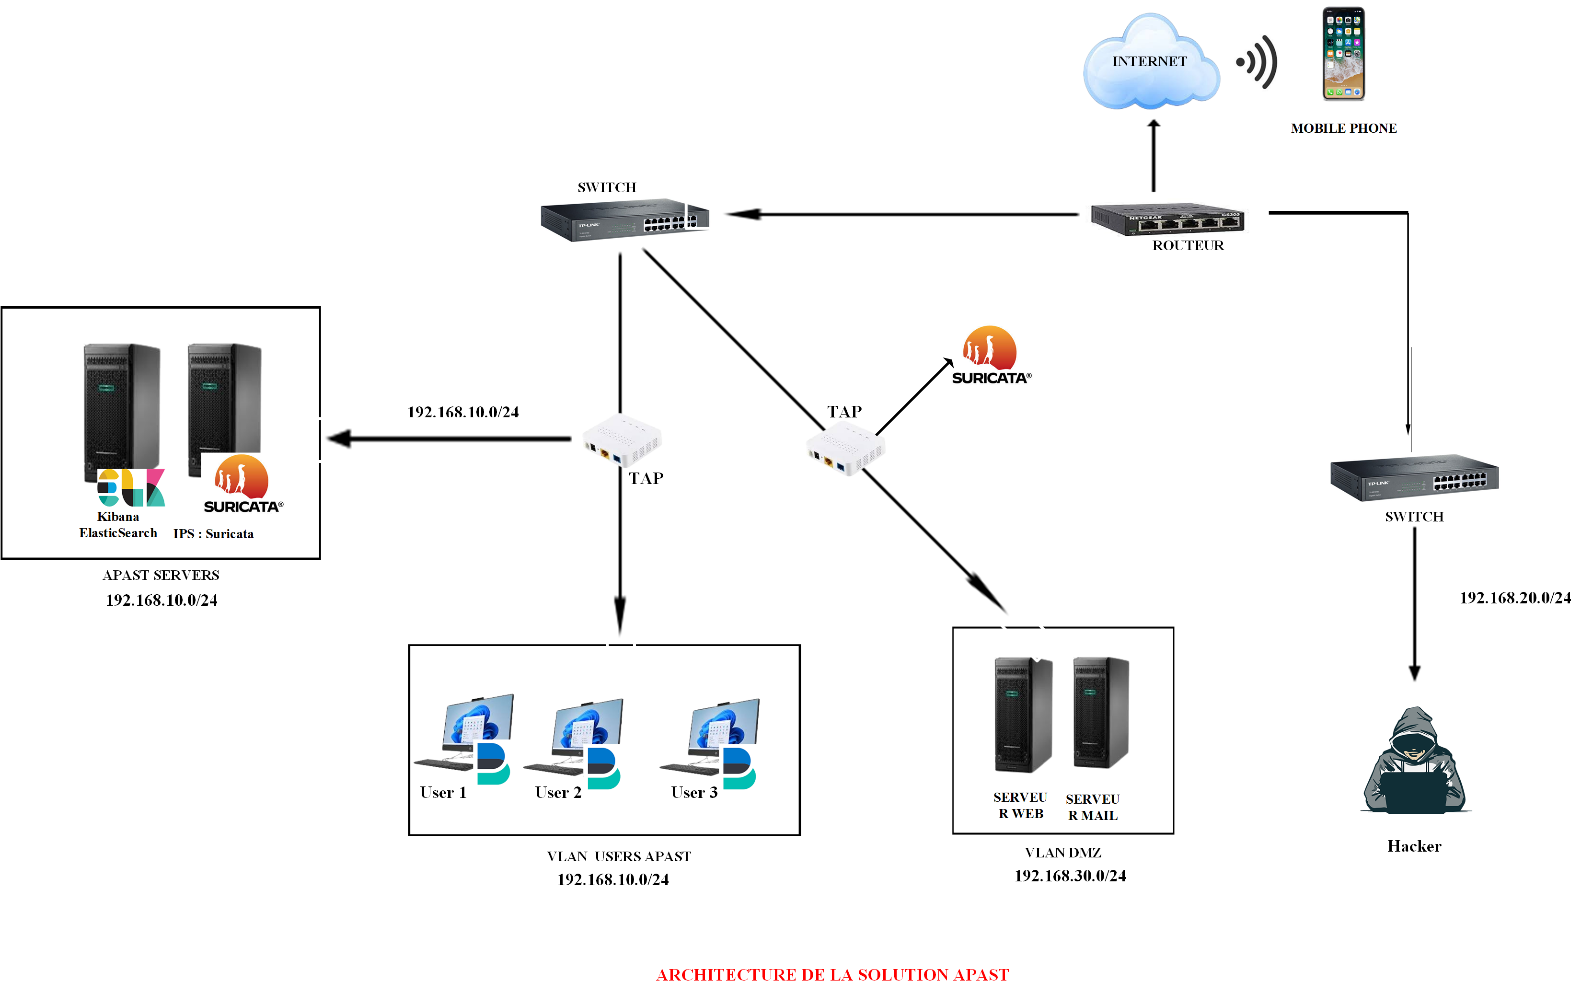 APAST network architecture diagram.
The network is segmented into three VLANs:
- VLAN USERS (192.168.10.0/24): user workstations, each running a Winlogbeat agent
- VLAN DMZ (192.168.30.0/24): web and mail servers exposed to the outside
- Attacker network (192.168.20.0/24): isolated simulation environment for testing
A TAP (Test Access Point) sits between the internal network and the router, passively mirroring all traffic to Suricata without interrupting any flows. Suricata inspects the mirrored traffic and forwards events to the ELK stack via Logstash.
Deployment environment:
| Machine | OS | RAM | Storage |
|---|---|---|---|
| ELK + Suricata server | Ubuntu 22.04 LTS | 8 GB | 100 GB |
| Client workstation | Windows 10 Pro | 4 GB | 50 GB |
| Attack machine | Kali Linux 2023.3 | 4 GB | 20 GB |
Dashboard
Once deployed, the Kibana interface gives a live view of everything happening on the network.
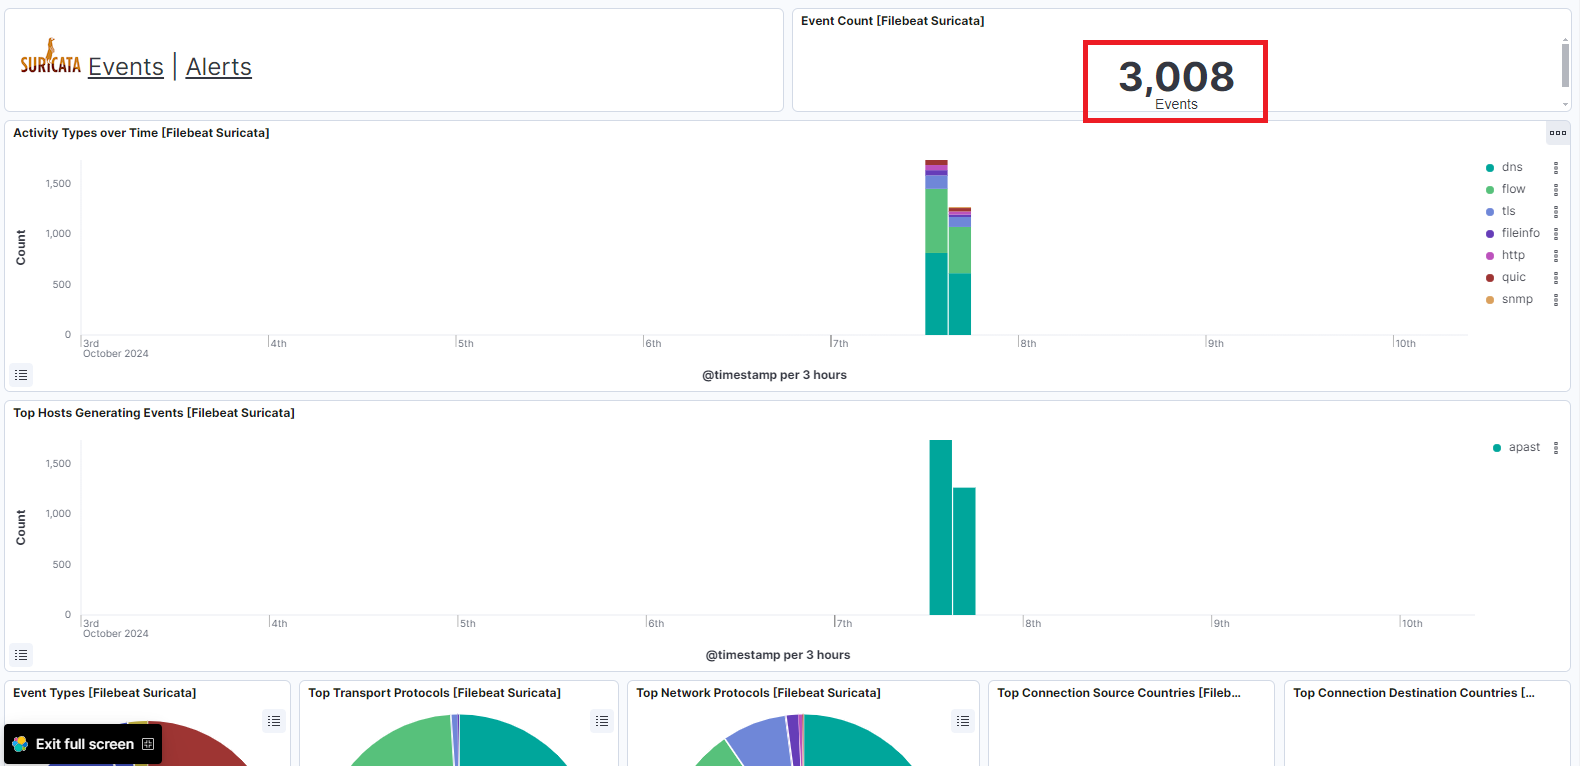 Suricata events dashboard in Kibana.
The Suricata events overview shows total event count, protocol distribution over time, and top hosts generating traffic. All logs are stored with full metadata: source/destination IPs, protocols, hostnames, timestamps.
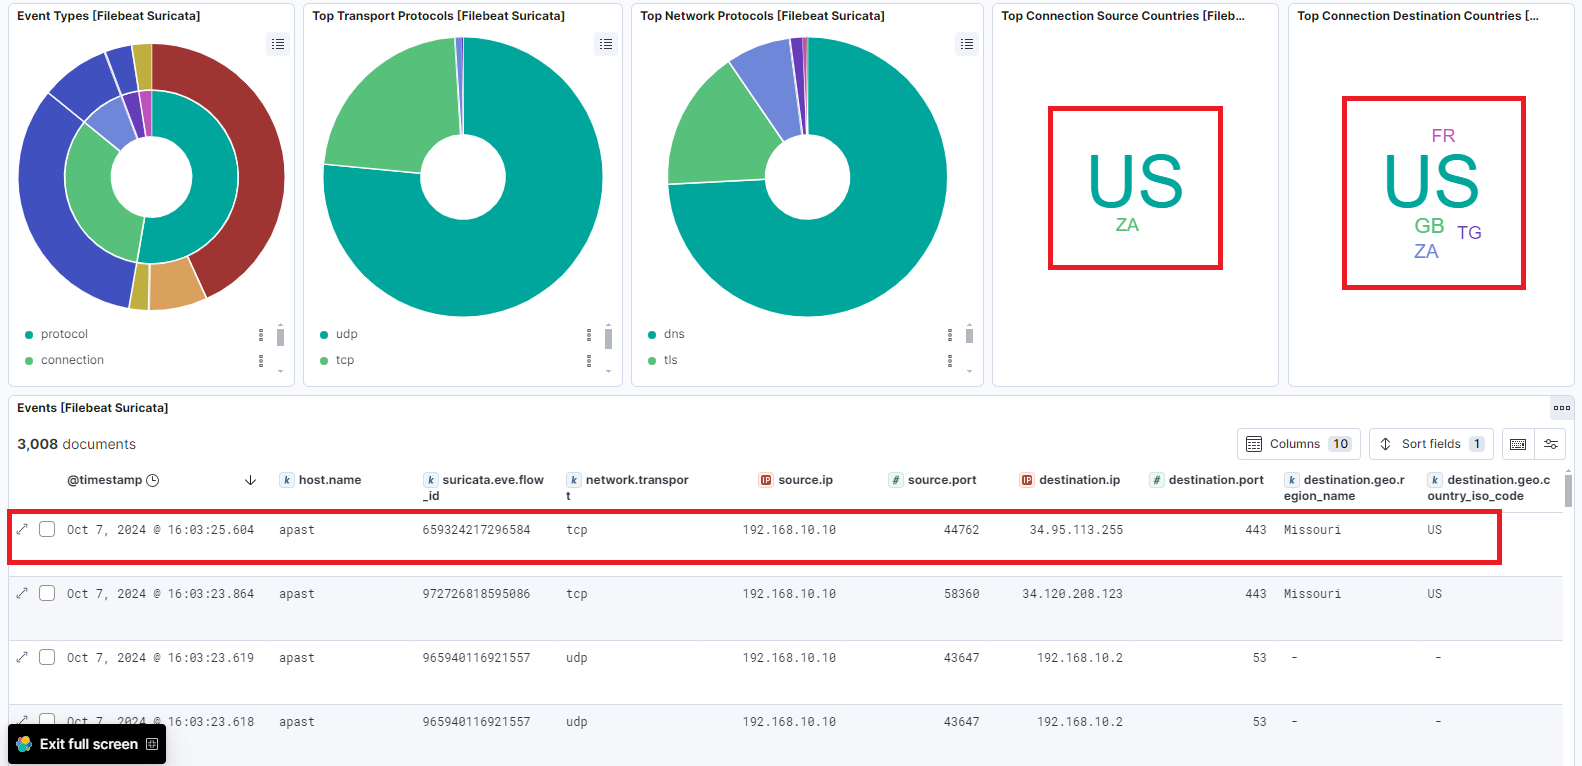 Kibana dashboard with GeoIP source tracing.
The “Attack Source Tracing” part of APAST: every IP detected in an attack is geolocated via Google Cloud and plotted on an interactive world map. This makes it easy to identify attack origins at a glance and build context around incidents.
One caveat. Geolocating an IP tells you where that address is registered, not who the attacker is or where they sit. Attackers usually go through VPNs, proxies, Tor or compromised machines, so the map gives context for an investigation. It is not attribution.
Tests
Three attack scenarios were run to validate the system.
Test 1: DoS attack
Attack: TCP flood from Kali Linux using hping3, targeting a host on the user VLAN.
Custom Suricata rule written to detect the pattern:
 Suricata DoS detection rule.
The attack was launched:
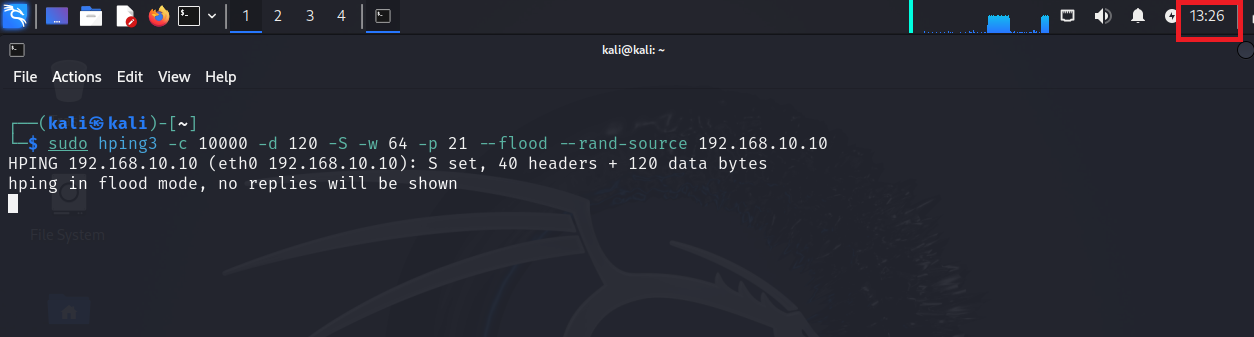 hping3 DoS attack from Kali Linux.
Suricata caught it immediately. The log entry shows the exact timestamp of detection, matching the moment the attack started:
 Suricata detection log: DoS attack.
The Telegram bot fired within seconds:
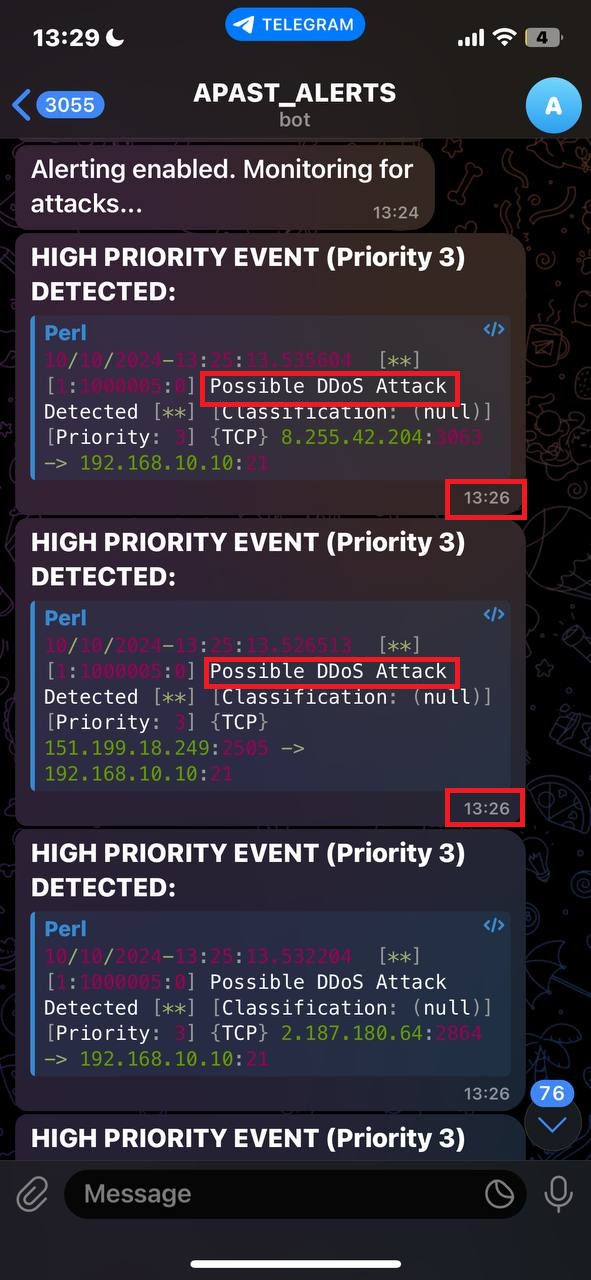 Telegram alert: DDoS attack detected.
Detection, logging, and notification: all three objectives cleared.
Test 2: SSH brute force
Attack: Hydra with the rockyou wordlist, targeting the SSH service on the ELK server.
Custom Suricata rule for the pattern (5 SYN packets to port 22 from the same source within 60 seconds):
 Suricata SSH brute force rule.
Same result: detected, logged, alert sent:
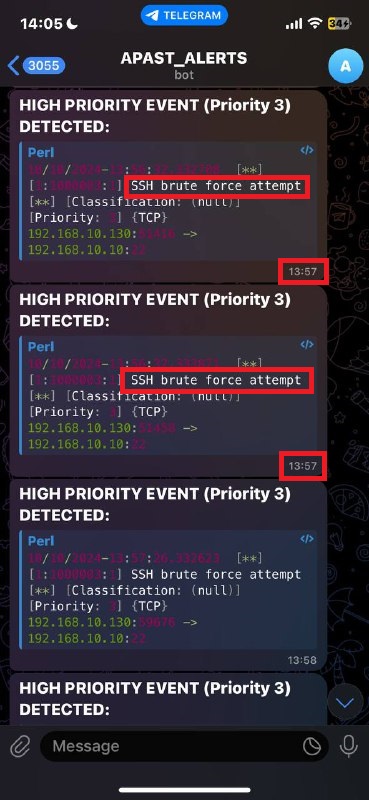 Telegram alert: SSH brute force attempt.
Test 3: Failed Windows login
Attack: Intentional wrong-password attempt on the Windows client.
Winlogbeat picked up the failed logon event and pushed it to Kibana. The dashboard updated in real time, showing the event timestamp, username, and the event.action: authentication_failed field. No custom rule was needed because Windows event ID 4625 is captured automatically.
What works well
- Dual coverage: Suricata handles the network layer, Winlogbeat handles Windows endpoints. Neither alone is enough; together they cover the main attack surfaces.
- Custom rules: Suricata’s rule syntax is flexible. New detection patterns can be added for specific threats without touching the rest of the stack.
- No vendor lock-in: the entire stack is open-source. Deploying it costs labor and hardware, nothing else.
- Real-time alerting: the Telegram integration means a security team gets notified within seconds, regardless of where they are.
Honest limitations
- Initial configuration is complex: getting Suricata, Elasticsearch, Logstash, Kibana, and Winlogbeat to talk to each other cleanly takes time. A misconfigured pipeline leads to silent failures.
- No behavioral analysis: the solution detects known patterns via rules. It won’t catch zero-days or insider threats that don’t match existing signatures. Integrating UEBA tools would address this.
- False positives: rule tuning is ongoing work. Out-of-the-box rules generate noise; they need to be calibrated to the actual environment.
Supervised by: Mr. TCHALA Komlan Djifa, Senior Cybersecurity Consultant, Cyber Defense Africa (CDA)